
52-Week High & Low Scanner
Select Sector and click "Scan 52-Week Ranges".
Disclaimer: 52-week high/low prices, historical averages (120-day & 180-day), and range proximity percentages are computed based on adjusted historical trade data for analytical research only.


Related Insights and Blogs

Navigating the NEPSE Bull Run: Introducing the All-New StockNepals.com
When the Nepal Stock Exchange (NEPSE) enters a bullish phase, the rising tide tends to lift many boats. Howeve...

Banks are allowed to sell their share investments only after 45 days.
Banks and financial institutions are now allowed to sell shares of companies listed on the securities market a...
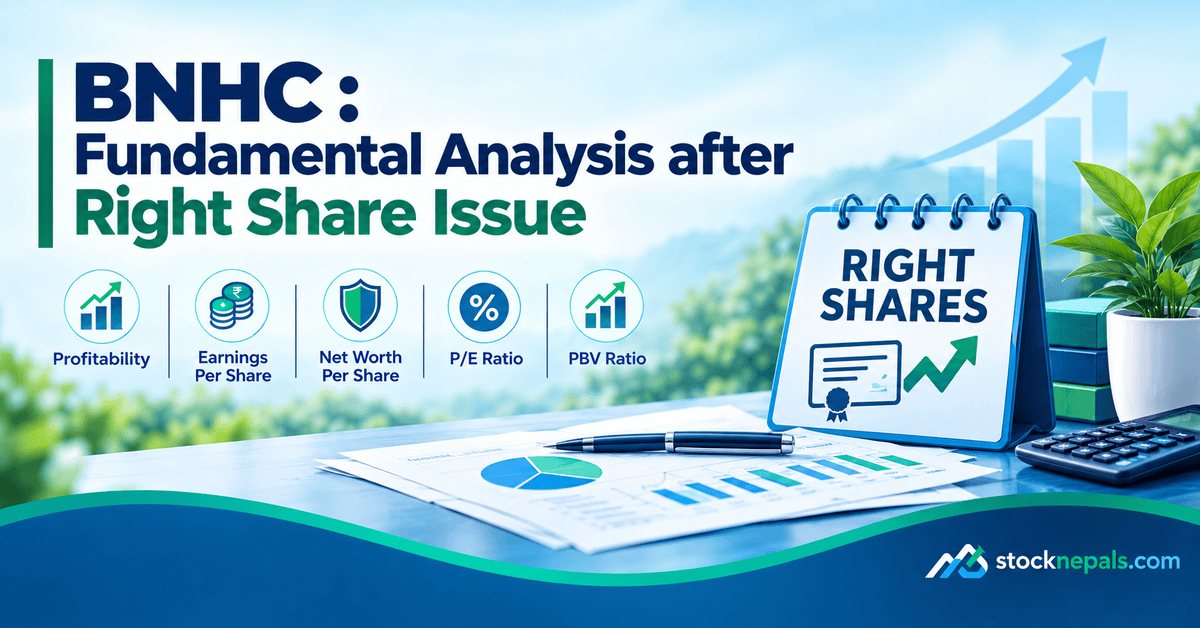
BNHC: Fundamental Analysis after Right Share Issue
Buddha Bhumi Nepal Hydro power Company Limited, listed on the Nepal Stock Exchange (NEPSE) under the symbol BN...
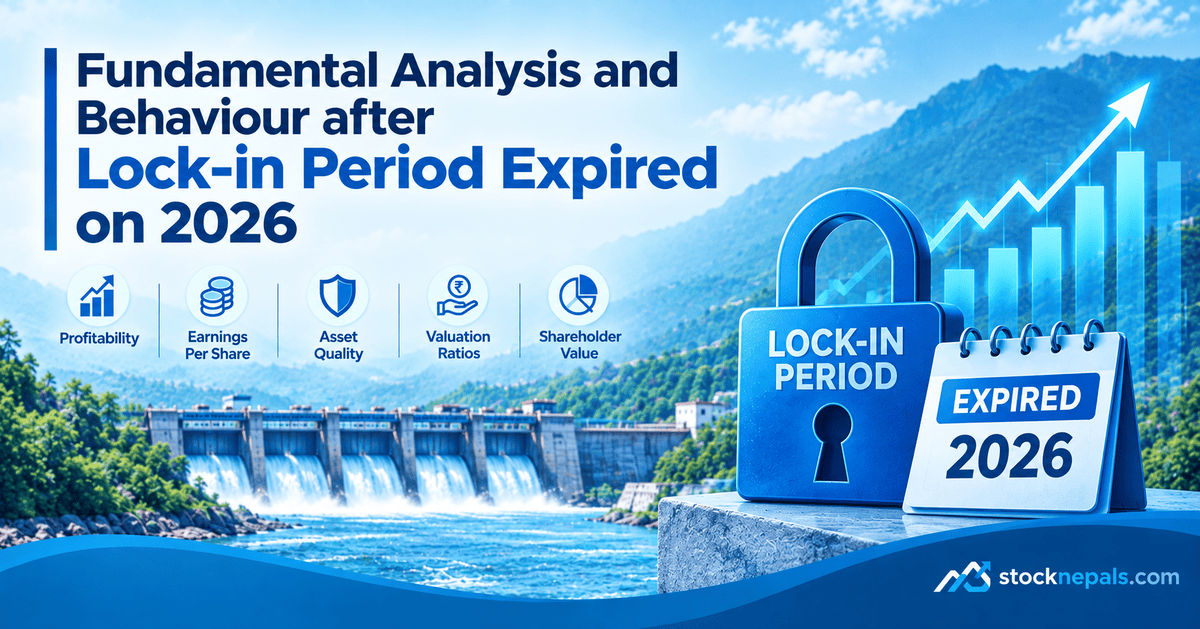
Fundamental analysis and Price Behavior after expiration of Lock-in period of SMJC
Sagarmatha Jalbidhyut Company Limited is a hydro-power company with the paid up capital of Rs. 1,173,200,000 a...