Market Insights & Blogs
Banking Sub-Index Breaks Out: Rally or Trap?
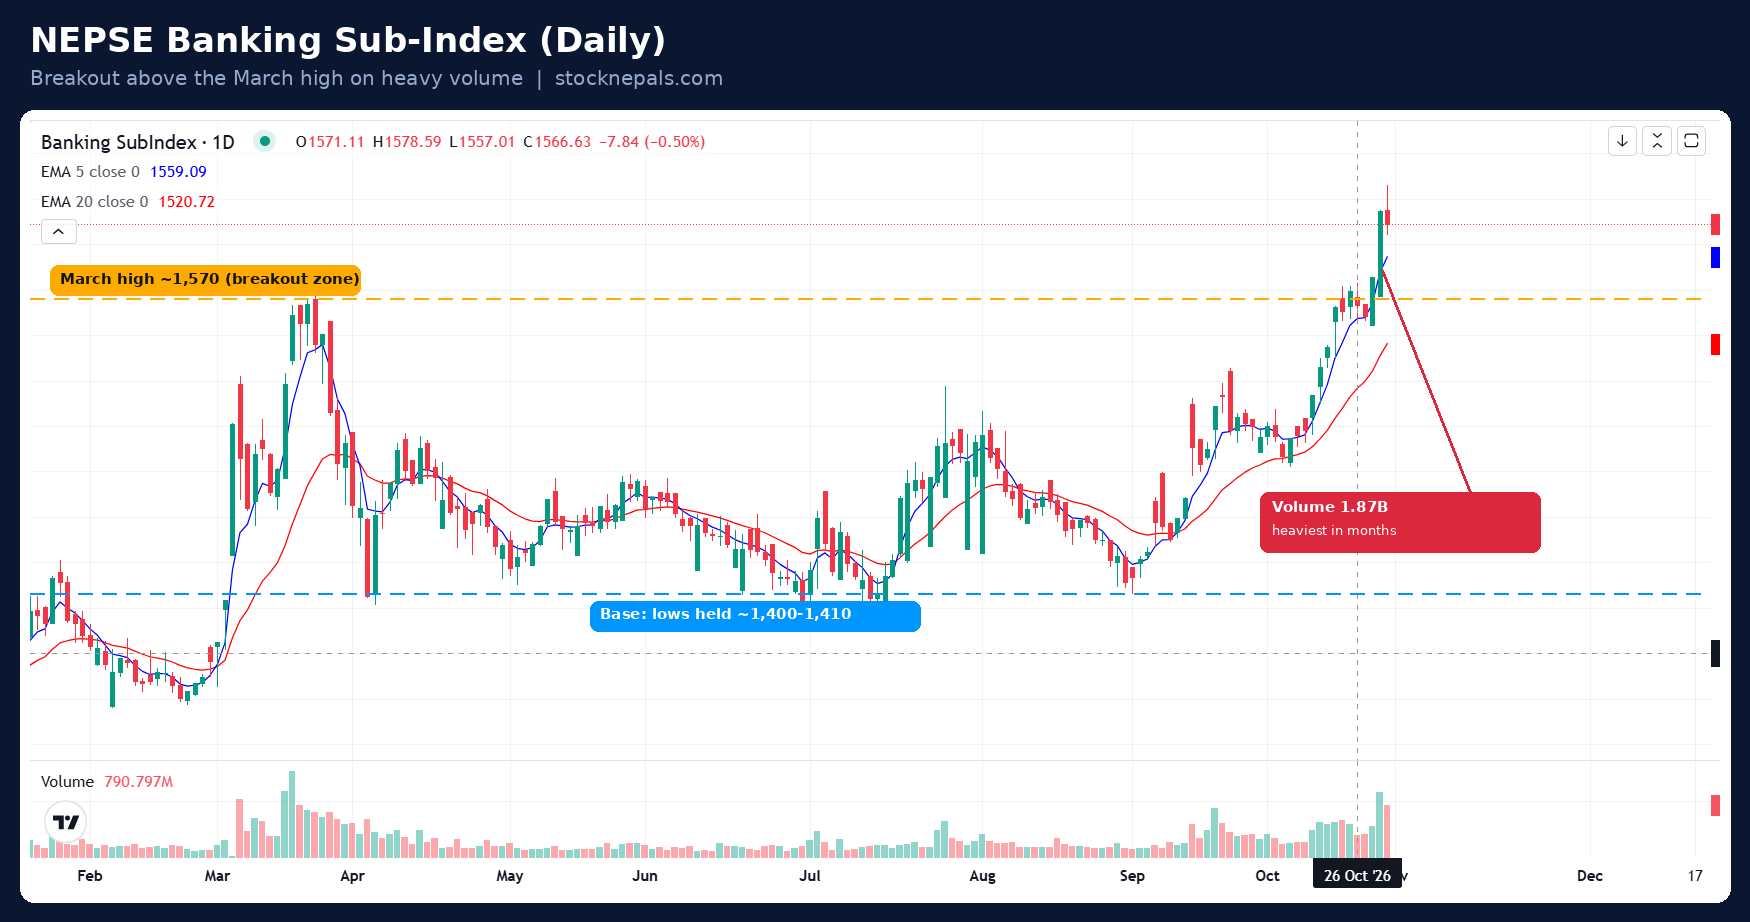
Nepal’s commercial banks have made a strong move over the past few weeks. The Banking Sub-Index, which spent most of the year stuck in a sideways range, has pushed to around 1,611 on the daily chart. That is roughly 14% above the early-September low near 1,408, and above the March high of about 1,570-1,575, which had capped every rally since. What the chart shows From April to September the index moved in a wide range, roughly 1,400 to 1,520, with the July and September lows both holding near 1,400-1,410. That kind of base-building often comes before a larger move. In October the index cleared the 1,500 mark, then the March high, and printed an intraday peak near 1,630. Price now sits above both moving averages. The 5-day EMA is around 1,593 and the 20-day EMA around 1,545, with the short average well above the long one, which confirms the strength of the uptrend. The volume is just as important. The latest session shows turnover of about 1.87 billion, the heaviest in the recent window and well above the typical 500-800 million days seen through the summer. A breakout to a new high on rising volume is a sign of real participation, not a thin drift upward. The latest candle, however, is red with a long upper shadow. Buyers pushed price toward 1,630 but could not hold it, which suggests some profit-taking at the highs. The Q1 reports: why the market is split The first-quarter banking reports have been mixed, and that leaves two possible readings of this rally. Possibility 1: “Buy the rumor, sell the news.” The index may have run up on expectations ahead of the results. If the numbers are not strong enough to justify the move, early buyers may use the news to book profits. In that case we could see a correction in banking stocks, with the 5-day EMA (~1,593) as first support, then the 20-day EMA (~1,545), and the old March high near 1,570 as a retest zone. Possibility 2: A bigger move for NEPSE as a whole. Banking stocks are the core of margin-eligible stocks, the ones investors pledge as collateral to take margin loans. When banks rise, the value of pledged portfolios rises, borrowing capacity increases, and fresh buying power flows into the wider market. If this is what is happening, the banking breakout may be the leading edge of a broader NEPSE rally, not an isolated sector move. What to watch The next few sessions should decide between the two. A pullback that holds above the March breakout zone and the 20-day EMA, on falling volume, would be a healthy retest and support the bullish case. A sharp drop back below ~1,570 on heavy volume would suggest the breakout failed and Possibility 1 is playing out. Either way, chasing a vertical move is risky, so wait for confirmation and manage position size. This article is for educational purposes only and is not investment advice.

Navigating the NEPSE Bull Run: Introducing the All-New StockNepals.com
When the Nepal Stock Exchange (NEPSE) enters a bullish phase, the rising tide tends to lift many boats. However, relying on generalized market optimism or social media rumors is rarely a sustainable strategy for maximizing returns. To truly capitalize on a bull market, traders and investors need to pinpoint precisely which stocks hold genuine momentum, which are quietly consolidating for a breakout, and where the volume is heavily concentrating. To bridge this gap between market noise and actionable data, we are proud to announce the launch of the completely revamped StockNepals.com. With a smarter, clearer, and more powerful interface, the new platform is engineered to transform raw market data into high-probability trading setups. Here is a look at the newly integrated features designed to give you a definitive edge in the market. Spot the Right Opportunities with Precision The upgraded StockNepals dashboard categorizes the market into clear, actionable segments so you can align your strategy with your trading timeframe. 1. Trend & Momentum Tracking Bull Run Stocks: Instantly filter for stocks exhibiting strong, sustained uptrend momentum. Don't guess which stocks are leading the rally; let the data show you. Momentum Gaining Stocks: Catch opportunities early by identifying assets that are just beginning to accelerate in price and volume, allowing you to enter before the trend becomes exhausted. 2. Breakout & Range Analysis Ready to Break Out: Monitor stocks that are approaching critical resistance levels. This feature tracks early technical signs of an impending breakout, ensuring you are positioned for the surge. Consolidated Stocks: Find hidden gems that have been resting in a tight trading range. Identifying accumulation phases before the next big markup is crucial for maximizing risk-to-reward ratios. 3. Actionable Buy Signals Short Term Buy Stocks: Tailored for swing traders, this module spots highly probable near-term technical setups, helping you capture quick gains in a volatile market. Long Term Buy Signals: For the patient investor, this feature filters out the day-to-day noise to highlight structurally sound companies presenting technically optimal entry points for long-term holding. 4. Market & Sector Health Index Status: Get a bird's-eye view of overall market trends, sector performance, and broader NEPSE volatility at a glance. Sector Volume: Track exactly where the money is flowing. By analyzing volume distribution across different sectors, you can identify institutional interest and sector rotations before they are reflected in massive price spikes. Upgrade Your Trading Arsenal Today The same trusted insights you expect from StockNepals are now housed in a significantly better interface, designed for both quick screening and deep analysis. Whether you are timing a short-term swing or building a long-term portfolio, having the right data visualization makes all the difference. To celebrate this major version launch, we are offering an exclusive, limited-time discount for our early adopters. You can unlock the complete, premium StockNepals package for Just Rs. 1500 (a sharp discount from the previous Rs. 2500 price tag). Please note, this offer is strictly limited to the first 200 users. Take control of your portfolio and make smarter, data-driven decisions today. Claim Your Spot Now: 💬 Message us on WhatsApp: 9849825532 🌐 Visit our new platform: www.stocknepals.com
Banks are allowed to sell their share investments only after 45 days.
Banks and financial institutions are now allowed to sell shares of companies listed on the securities market after just 45 days of investment. The central bank issued a directive on Thursday reducing the previous holding period from 6 months to only 45 days. Until now, banks were required to hold their investments in the capital market for at least 6 months. Following Thursday’s directive, banks and financial institutions can now invest with a plan to sell shares or debentures after 45 days. According to the directive, investment in shares and debentures of listed organized institutions in the securities market must be for a period of more than 45 days. In addition, the central bank has introduced a provision that prohibits any form of short-term investment in shares and debentures of organized institutions through any mechanism. The central bank has also stipulated that banks and financial institutions must include policy-related provisions in their investment policies and procedures. These procedures should cover the objectives and strategies of investment, the types of instruments such as shares and debentures in which investment can be made, and the classification of these instruments into banking book and trading book.
















.png)
 (1) (3).png)
.png)


.png)
.png)


